Wick Highlight IndicatorDescription:
This script is designed to help traders quickly spot significant wicks, which indicate areas of strong market rejection. By focusing on longer wicks, it identifies potential turning points where there was a strong buying or selling reaction.
Features:
Adjustable Minimum Wick Length: Users can set the minimum length of wicks to be highlighted, helping filter out less significant wicks. Default is set at 50 points.
Seller and Buyer Wick Analysis: Highlights both the top (seller pressure) and bottom (buyer pressure) wicks separately, giving a clearer view of market strength and rejection.
Non-Intrusive Display: Wicks are highlighted in black at 10% opacity, providing clear visual markers while keeping the chart clean and readable.
How to Use It: This indicator is open-source and free for all users. It aims to identify wicks that are larger than the average noise, which often indicates strong price rejections or future targets. You can adjust the minimum length to tailor the indicator to different market conditions and trading styles.
Why It Matters: Wicks often signify moments when price levels were rejected strongly, pointing to areas of potential support or resistance. By focusing only on significant wicks, this indicator helps you hone in on potential key levels of interest without overwhelming the chart with less important data. This can be particularly useful in spotting reversals or market exhaustion.
No other indicators are required, and the chart is kept clean for clarity and ease of understanding.
Notes:
This is an open-source script, and no solicitations or ads are included.
The indicator is intended to highlight significant wicks only and does not issue any buy/sell signals.
It is compliant with TradingView's publishing rules, focusing on transparency, clarity, and adding value to the community.
Wyszukaj w skryptach "Buy sell"

2Rsi buy & sell & candlesticks patterns in rsi[Trader's Journal]An Ingenious Trading Indicator: RSI, Japanese Candlesticks, and Buy/Sell Signals
The world of trading is a subtle game of analysis, where the smallest piece of information can make the difference between success and failure. In this perpetual quest to anticipate market movements, one indicator stands out: the Relative Strength Index (RSI), a powerful tool that measures the strength of price movements. However, RSI alone may not always suffice for informed trading decisions.
This is where our indicator comes into play, adding a new dimension to your analysis. The indicator skillfully combines RSI with Japanese candlesticks, those small candles rich in market movement information. The goal is clear: to generate buy and sell signals during trend reversals while keeping a keen eye on overbought and oversold zones.
RSI: Guardian of Extremes
The RSI is a basic tool that measures buying and selling pressure on an asset. It oscillates between 0 and 100, signaling overbought levels when the RSI exceeds 70 and oversold levels below 30. These extreme zones are often the stage for trend reversals, but timing is crucial.
Japanese Candlesticks: Messengers of the Market
Japanese candlesticks are more than just candles on a chart. They depict market emotions, reflecting the ongoing struggle between buyers and sellers. Trend reversals are typically heralded by specific candlestick patterns such as the Bearish Engulfing, Evening Star, or Inverted Hammer. These candlesticks act as powerful visual signals.
The Indicator in Action: Timing and Confirmation
When the RSI reaches the overbought zone (above 70) or oversold zone (below 30), our indicator is on alert. This is when vigilance is at its peak. However, buy and sell signals don't occur automatically. They await confirmation from Japanese candlesticks.
For a sell signal, the indicator awaits an exit from the overbought zone, followed by a bearish reversal candlestick. When these conditions are met, the sell signal is triggered. For a buy signal, the process is similar, but upon exiting the oversold zone and in the presence of a bullish candlestick.
The Elegance of the Combination
The beauty of this indicator lies in its ability to combine RSI analysis with the power of Japanese candlesticks. It doesn't just predict trend reversals, it does so elegantly, demanding visual confirmation, thus avoiding false signals.
As the market moves relentlessly, this indicator is your ally for making informed decisions. It reminds you that the wisdom of trading lies in combining different analytical tools to decipher the mysteries of the financial market. Envelop your trading strategies with this indicator, and witness how it can illuminate your path to success.

Support and Resistance Signals MTF [LuxAlgo]The Support and Resistance Signals MTF indicator aims to identify undoubtedly one of the key concepts of technical analysis Support and Resistance Levels and more importantly, the script aims to capture and highlight major price action movements, such as Breakouts , Tests of the Zones , Retests of the Zones , and Rejections .
The script supports Multi-TimeFrame (MTF) functionality allowing users to analyze and observe the Support and Resistance Levels/Zones and their associated Signals from a higher timeframe perspective.
This script is an extended version of our previously published Support-and-Resistance-Levels-with-Breaks script from 2020.
Identification of key support and resistance levels/zones is an essential ingredient to successful technical analysis.
🔶 USAGE
Support and resistance are key concepts that help traders understand, analyze and act on chart patterns in the financial markets. Support describes a price level where a downtrend pauses due to demand for an asset increasing, while resistance refers to a level where an uptrend reverses as a sell-off happens.
The creation of support and resistance levels comes as a result of an initial imbalance of supply/demand, which forms what we know as a swing high or swing low. This script starts its processing using the swing highs/lows. Swing Highs/Lows are levels that many of the market participants use as a historical reference to place their trading orders (buy, sell, stop loss), as a result, those price levels potentially become and serve as key support and resistance levels.
One of the important features of the script is the signals it provides. The script follows the major price movements and highlights them on the chart.
🔹 Breakouts (non-repaint)
A breakout is a price moving outside a defined support or resistance level, the significance of the breakout can be measured by examining the volume. This script is not filtering them based on volume but provides volume information for the bar where the breakout takes place.
🔹 Retests
Retest is a case where the price action breaches a zone and then revisits the level breached.
🔹 Tests
Test is a case where the price action touches the support or resistance zones.
🔹 Rejections
Rejections are pin bar patterns with high trading volume.
Finally, Multi TimeFrame (MTF) functionality allows users to analyze and observe the Support and Resistance Levels/Zones and their associated Signals from a higher timeframe perspective.
🔶 SETTINGS
The script takes into account user-defined parameters to detect and highlight the zones, levels, and signals.
🔹 Support & Resistance Settings
Detection Timeframe: Set the indicator resolution, the users may examine higher timeframe detection on their chart timeframe.
Detection Length: Swing levels detection length
Check Previous Historical S&R Level: enables the script to check the previous historical levels.
🔹 Signals
Breakouts: Toggles the visibility of the Breakouts, enables customization of the color and the size of the visuals
Tests: Toggles the visibility of the Tests, enables customization of the color and the size of the visuals
Retests: Toggles the visibility of the Retests, enables customization of the color and the size of the visuals
Rejections: Toggles the visibility of the Rejections, enables customization of the color and the size of the visuals
🔹 Others
Sentiment Profile: Toggles the visibility of the Sentiment Profiles
Bullish Nodes: Color option for Bullish Nodes
Bearish Nodes: Color option for Bearish Nodes
🔶 RELATED SCRIPTS
Support-and-Resistance-Levels-with-Breaks
Buyside-Sellside-Liquidity
Liquidity-Levels-Voids

Simple Grid Lines VisualizerAbout Grid Bots
A grid bot is a type of trading bot or algorithm that is designed to automatically execute trades within a predefined price range or grid. It is commonly used in markets that exhibit ranging or sideways movement, where prices tend to fluctuate within a specific range without a clear trend.
The grid bot strategy involves placing a series of buy and sell orders at regular intervals within the predefined price range or grid. The bot essentially creates a grid of orders, hence the name. When the price reaches one of these levels, the bot will execute the corresponding trade. For example, if the price reaches a predefined lower level, the bot will buy, and if it reaches a predefined upper level, it will sell.
The purpose of the grid bot strategy is to take advantage of the price oscillations within the range. As the price moves up and down, the bot aims to generate profits by buying at the lower end of the range and selling at the higher end. By repeatedly buying and selling at these predetermined levels, the bot attempts to capture gains from the price fluctuations.
About this Script
Simple Grid Lines Visualizer is designed to assist traders in visualizing and implementing automated price grids on their charts. With just a few inputs, this script generates gridlines based on your specified top price, bottom price, and the number of grids or profit per grid.
How it Works:
Specify Top and Bottom Prices: Start by setting the top and bottom prices that define the range within which the gridlines will be generated. These prices can be based on support and resistance levels, historical data, or any other factors you consider relevant to your analysis.
Determine Grid Parameters: Choose either the number of grids or profit per grid, depending on your preference and trading strategy. If you select the number of grids, the script will evenly distribute the gridlines within the specified price range. Alternatively, if you opt for profit per grid, the script will calculate the price increment required to achieve your desired profit level per grid.
Note that when choosing Profit per Grid , an approximation usually is performed, as all grid lines must be evenly distributed. To achieve that, the script computes the grid distance using the mean price between top and bottom, then computes how many of those complete distances may enter the entire range, and lastly, creates a grid with evenly distributed distances as close as possible to the previously computed.
Customize Styling and Display: Adjust the line color, line style, transparency, and other visual aspects to ensure clear visibility on your charts.
Analyze and Trade: Once the gridlines are plotted on your chart, carefully observe how the market interacts with them. The gridlines can act as reference points for potential support and resistance levels, as well as simple buy/sell orders for a trading bot.
Try to find gridlines that intersect prices as frequently as possible from one to another.
A grid with too many lines will make lots of potential trades, but the amount traded will be minimal (as the total amount invested is divided over the number of grids).
A grid with too few lines will make lots of profits with each trade, but the trades will be less likely to occur (depending on the top/bottom distance).
This tool aims to help visually which grid parameters seem to optimize this problem.
Future versions may include automatic profit computation.

Reversal Signals [LuxAlgo]The Reversal Signals indicator is a technical analysis tool that aims to identify when a trend is fading and potentially starting to reverse.
As a counter-trend tool, the Reversal Signals indicator aims to solve the problem of several technical analysis indicators that perform well during trending markets but struggle in ranging markets. By understanding the key concepts and applications of the tool, traders can enhance their market timing and improve their trading strategies.
Note: It's important to explore the settings of the indicator to customize to your own usage & display as there are various options available as covered below.
🔶 USAGE
The Reversal Signals indicator is comprised of two main phases: Momentum Phase and Trend Exhaustion Phase . These phases help identify potential trend reversals in bullish, bearish, and ranging markets.
🔹The Momentum Phase
The momentum phase consists of a 9-candle count and in rare cases 8-candle count. In a bullish trend, a starting number ‘1’ is plotted if a candle closes higher than the close of a candle four periods ago. In a bearish trend, a starting number ‘1’ is plotted if a candle closes lower than the close of a candle four periods ago.
The following numbers are plotted when each successive candle satisfies the four-period rule. The potential reversal point comes when the Reversal Signals plot a label on top of a candle in a bullish trend or at the bottom of a candle in a bearish trend. The momentum phase is immediately canceled if, at any point, a candle fails to satisfy the four-period rule.
Based on the extremes of the momentum phase, the Reversal Signals generate support & resistance levels as well as risk/stop levels.
🔹 The Trend Exhaustion Phase
The trend exhaustion phase starts after completing the momentum phase and consists of a 13-candle count. In a bullish trend exhaustion phase, each candle’s close is compared to the close of two candles earlier, and the close must be greater than the close two periods earlier. In a bearish trend exhaustion phase, each candle’s close is compared to the close of two candles earlier, and the close must be lower than the close two periods earlier.
The trend exhaustion phase does not require a consecutive sequence of candles; if the order of candles is interrupted, the trend exhaustion phase is not canceled. The trend exhaustion phase generates stronger trading signals than the momentum phase, with the potential for longer-lasting price reversals.
🔹 Trading Signals
The Reversal Signals script presents an overall setup and some phase-specific trade setup options, where probable trades might be considered. All phase-specific trade setups, presented as options, are triggered once the selected phase is completed and followed by a price flip in the direction of the trade setup.
Please note that those setups are presented for educational purposes only and do not constitutes professional and/or financial advice
- Momentum: Enter a trade at momentum phase completion, and search for buy (sell) when the bullish (bearish) momentum phase pattern is complete. Ideally, the momentum phase completion should close near its support/resistance line but shall not be above them, which indicates continuation of the trend
- Exhaustion: Enter a trade on trend exhaustion phase completion, and search for buy (sell) when the bullish (bearish) trend exhaustion phase is complete
- Qualified: Buy (sell) when a bullish (bearish) trend exhaustion phase combined with another bullish (bearish) momentum phase sequence is complete
Long trade setups are presented with "L" label and short trade setups with "S" label, where the content of the label displays details related to the probable trade opportunity
Once a phase-specific trade setup is triggered then the Reversal Signals script keeps checking the status of the price action relative to the phase-specific trade setups and in case something goes wrong presents a caution label. Pay attention to the content of the caution labels as well as where they appear. A trade signal, followed immediately by a warning indication can be assumed as a continuation of the underlying trend and can be traded in the opposite direction of the suggested signal
It is strongly advised to confirm trading setups in conjunction with other forms of technical and fundamental analysis, including technical indicators, chart/candlestick pattern analysis, etc.
🔶 DETAILS
The Reversal Signals script performs the detection of the phases by counting the candlestick meeting the specific conditions, which includes:
- Detection of the 8th and 9th candle perfection during the momentum phase
- In some cases, the 8th count will be assumed as momentum phase completion
- Trend exhaustion phase counting stops in case any type of momentum phase completion is detected during the counting process
- Postponing the last count of the trend exhaustion phase, the 13th candle must be below/above the 8th candle and if not the candles will be indicated with '+' sign under them and the script continues to search for a 13th candle at the next ones until the conditions are met
🔶 ALERTS
When an alert is configured, the user will have the ability to be notified in case;
Momentum / Trend Exhaustion phase completion
Support & Resistance level cross detection
Stop / Risk level cross detection
Long / Short Trade Setups are triggered
Please note, alerts are available with 'any alert() function call' and the alerts will be received only for the features that are enabled during alert configuration
🔶 SETTINGS
🔹 Momentum Phase
Display Phases: displays the momentum phases, where the Completed option allows the display of only completed momentum phases. The detailed option allows the display of the entire process of the momentum phase processes
Support & Resistance Levels: Toggles the visibility of the Support & Resistance Levels and Line Styling options
Momentum Phase Risk Levels: Toggles the visibility of the momentum phase Stop/Risk Levels and Line Styling options
For color options please refer to the options available under the style tab
🔹 Trend Exhaustion Phase
Display Phases: displays the trend exhaustion phases, where the Completed option allows the display of only completed trend exhaustion phases. The detailed option allows the display of the entire process of the trend exhaustion phase processes
Trend Exhaustion Phase Risk Levels: Toggles the visibility of the trend exhaustion phase Stop/Risk Levels
Trend Exhaustion Phase Target Levels: Toggles the visibility of the trend exhaustion phase Target Levels
For color options please refer to the options available under the style tab
🔹 Trade Setups
Overall Trend Direction & Trade Setup: displays the overall trend and probable trade setup levels, the users should search for a price flip and confirm with other means of technical and fundamental analysis for the trade setups once the label is plotted
Phase-Specific Trade Setup Options
Momentum: Searches for a trade setup after momentum phase completion
Exhaustion: Searches for a trade setup after trend exhaustion phase completion, stronger trend reversal possibility compared to momentum phase setup
Qualified: Searches for a trade setup after the trend exhaustion phase followed by a momentum phase completion
None: No trade setups are presented
Price Flips against the Phase Specific Trade Setups: enables checking the price action relative to the phase-specific trade setups
🔶 RELATED SCRIPTS
Here are the scripts that may add additional insight during potential trading decisions.
Buyside-Sellside-Liquidity
Support-Resistance-Classification

Directional Volume EStimate from Price Action (RedK D_VESPA)The "Directional Volume EStimate from Price Action (RedK D_VESPA)" is another weapon for the VPA (Volume Price Analysis) enthusiasts and traders who like to include volume-based insights & signals to their trading. The basic concept is to estimate the sell and buy split of the traded volume by extrapolating the price action represented by the shape of the associated price bar. We then create and plot an average of these "estimated buy & sell volumes" - the estimated average Net Volume is the balance between these 2 averages.
D_VESPA uses clear visualizations to represent the outcomes in a less distracting and more actionable way.
How does D_VESPA work?
-------------------------------------
The key assumption is that when price moves up, this is caused by "buy" volume (or increasing demand), and when the price moves down, this is due to "selling" volume (or increasing supply). Important to note that we are making our Buy/sell volume estimates here based on the shape of the price bar, and not looking into lower time frame volume data - This is a different approach and is still aligned to the key concepts of VPA.
Originally this work started as an improvement to my Supply/Demand Volume Viewer (V.Viewer) , I ended up re-writing the whole thing after some more research and work on VPA, to improve the estimation, visualization and usability / tradability.
Think of D_VESPA as the "Pro" version of V.Viewer -- and please go back and review the details of V.Viewer as the root concepts are the same so I won't repeat them here (as it comes to exploring Balance Zone and finding Price Convergence/Divergence)
Main Features of D_VESPA
--------------------------------------
- Update Supply/Demand calculation to include 2-bar gaps (improved algo)
- Add multiple options for the moving average (MA type) for the calculation - my preference is to use WMA
- Add option to show Net Volume as 3-color bars
- Visual simplification and improvements to be less distracting & more actionable
- added options to display/hide main visuals while maintaining the status line consistency (Avg Supply, Avg Demand, Avg Net)
- add alerts for NetVol moving into Buy (crosses 0 up) or Sell (crosses 0 down) modes - or swing from one mode to the other
(there are actually 2 sets of alerts, one set for the main NetVol plot, and the other for the secondary TF NetVol - give user more options on how to utilize D_VESPA)
Quick techie piece, how does the estimated buy/sell volume algo work ?
------------------------------------------------------------------------------------------
* per our assumption, buy volume is associated with price up-moves, sell volume is associated with price down-moves
* so each of the bulls and bears will get the equivalent of the top & bottom wicks,
* for up bars, bulls get the value of the "body", else the bears get the "body"
* open gaps are allocated to bulls or bears depending on the gap direction
The below sketch explains how D_VESPA estimates the Buy/Sell Volume split based on the bar shape (including gap) - the example shows a bullish bar with an opening gap up - but the concept is the same for a down-bar or a down-gap.
I kept both the "Volume Weighted" and "2-bar Gap Impact" as options in the indicator settings - these 2 options should be always kept selected. They are there for those who would like to experiment with the difference these changes have on the buy/sell estimation. The indicator will handle cases where there is no volume data for the selected symbol, and in that case, it will simply reflect Average Estimated Bull/Bear ratio of the price bar
The Secondary TF Est Average Net Volume:
---------------------------------------------------------
I added the ability to plot the Estimate Average Net Volume for a secondary timeframe - options 1W, 1D, 1H, or Same as Chart.
- this feature provides traders the confidence to trade the lower timeframes in the same direction as the prevailing "market mode"
- this also adds more MTF support beyond the existing TradingView's built-in MTF support capability - experiment with various settings between exposing the indicator's secondary TF plot, and changing the TF option in the indicator settings.
Note on the secondary TF NetVol plot:
- the secondary TF needs to be set to same as or higher TF than the chart's TF - if not, a warning sign would show and the plot will not be enabled. for example, a day trader may set the secondary TF to 1Hr or 1Day, while looking at 5min or 15min chart. A swing/trend trader who frequently uses the daily chart may set the secondary TF to weekly, and so on..
- the secondary TF NetVol plot is hidden by default and needs to be exposed thru the indicator settings.
the below chart shows D_VESPA on a the same (daily) chart, but with secondary TF plot for the weekly TF enabled
Final Thoughts
-------------------
* RedK D_VESPA is a volume indicator, that estimates buy/sell and net volume averages based on the price action reflected by the shape of the price bars - this can provide more insight on volume compared to the classic volume/VolAverage indicator and assist traders in exploring the market mode (buyers/sellers - bullish/bearish) and align trades to it.
* Because D_VESPA is a volume indicator, it can't be used alone to generate a trading signal - and needs to be combined with other indicators that analysis price value (range), momentum and trend. I recommend to at least combine D_VESPA with a variant of MACD and RSI to get a full view of the price action relative to the prevailing market and the broader trend.
* I found it very useful to take note and "read" how the Est Buy vs Est Sell lines move .. they sort of "tell a story" - experiment with this on your various chart and note the levels of estimate avg demand vs estimate avg supply that this indicator exposes for some very valuable insight about how the chart action is progressing. Please feel free to share feedback below.

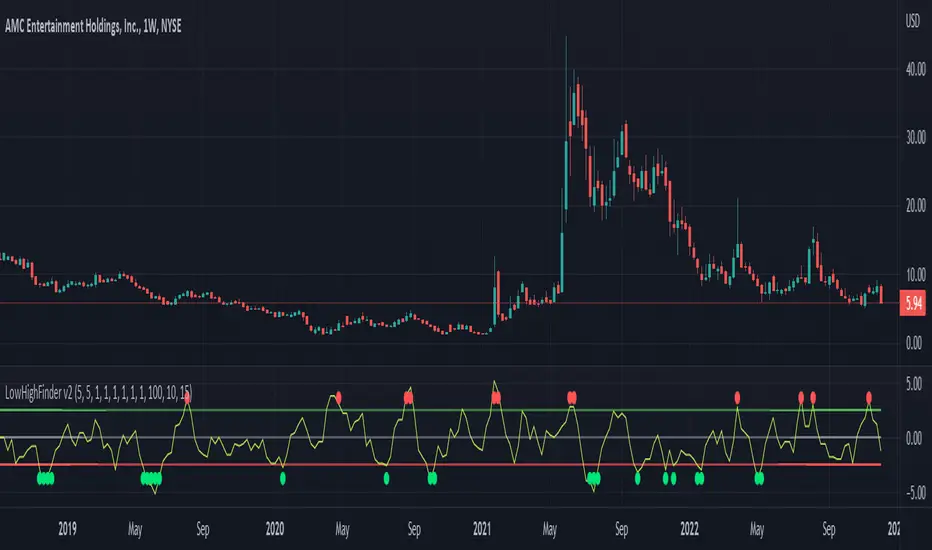
LowHighFinderThis chart display how value change of (low,high,close,open) is considered as a factor for buying or selling. Each element take same weight when consider the final price. The price change over a certain threshold would be the decision point (buy/sell)
Factors considered in this chart
1.Quotes: High,low,close,open,volume. If one of them higher than previous day, then it increase, otherwise decreases.
2. Multipler: If you think one quote is more important than other (High more important than close, you can set multipler higher)
3. EMA smoother: It is using to balance the price effect. Like if price increased dramatically, EMA would notify whether could be a good time to sell. (Because high deviation between MA and price suggest price increase too fast)
4. Length of line: set length of line for you need
5. Percentage change: how much percentage change is considered a significant change? 5%? or 10%? In which case should it count toward the final indicator? Adjust percentage change needed, smaller for minutes chart (less than 10) higher for hours chart (10-20), even higher for day chart
Buy/Sell method:
1. When green dot appears, wait after price start to get close to moving average to find the low point and buy.
2. Reverse for red dot.
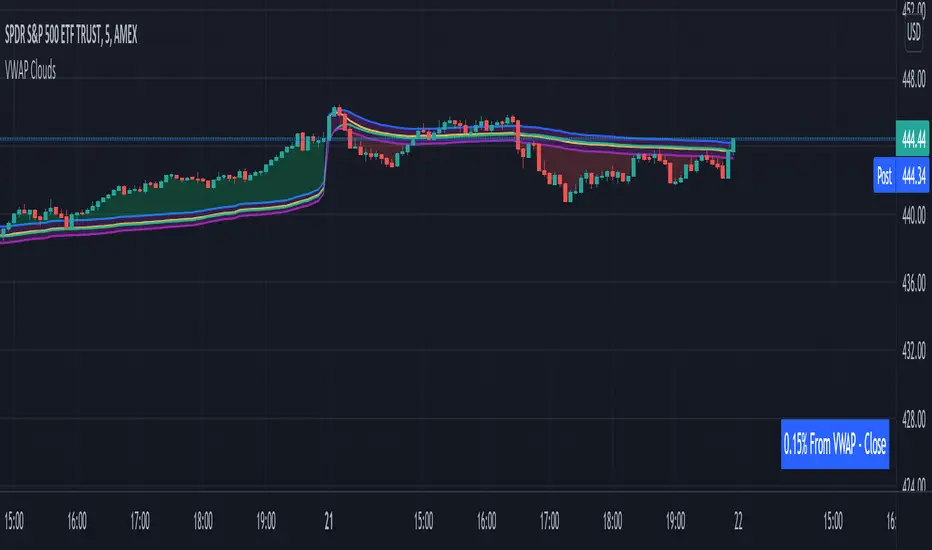
VWAP From Multiple Sources With Cloud & Percentage GapVWAP CLOUD FROM CLOSE, OPEN, HIGH & LOW SOURCES WITH CLOUD & PERCENTAGE GAP
VWAP stands for volume weighted average price and shows the average price of buys/sells based on volume traded across the current session. This VWAP is based off of the Daily session.
***HOW TO USE***
Use the purple cloud between the VWAPs as your entry points as price will typically bounce from that cloud area.
The Yellow Line is the VWAP using the close price as a source.
The Green Line is the VWAP using the open price as a source.
The Blue Line is the VWAP using the high price as a source.
The Purple Line is the VWAP using the low price as a source.
When price is above the VWAP cloud, the background will paint green because the trend is bullish.
When price is below the VWAP cloud, the background will paint red because the trend is bearish.
In the bottom right hand corner, three is a table that will show you the current percentage gap between current price and the VWAP using close as the source.
All sources and colors can be easily switched in the settings menu.
***MARKETS***
This indicator can be used as a signal on all markets, including stocks, crypto, futures and forex.
***TIMEFRAMES***
This vwap indicator can be used on all timeframes but is calculated using the daily session.
***TIPS***
Try using numerous indicators of ours on your chart so you can instantly see the bullish or bearish trend of multiple indicators in real time without having to analyze the data. Some of our favorites are our Auto Fibonacci, Volume Profile, Directional Movement Index, Momentum, Auto Support And Resistance and Money Flow Index in combination with this VWAP Cloud. The other indicators all have real time Bullish and Bearish labels as well so you can immediately understand each indicator's trend.
Moon Phases Strategy [LuxAlgo]Trading moon phases has become quite popular among traders, believing that there exists a relationship between moon phases and market movements. This strategy is based on an estimate of moon phases with the possibility to use different methods to determine long/short positions based on moon phases.
Note that we assume moon phases are perfectly periodic with a cycle of 29.530588853 days (which is not realistically the case), as such there exists a difference between the detected moon phases by the strategy and the ones you would see. This difference becomes less important when using higher timeframes.
Settings
New Moon Reference Date: Date of a new moon to be used as starting point for the cycle calculation. Buy: Determine the condition to be used to open a long position Sell: Determine the condition to be used to open a short position
Description
The strategy can use different buy/sell conditions, these are determined in the Buy/Sell settings drop-down menu.
By default, the strategy goes long on a new moon and short on a full moon. This setup is common since full moons are said to be related to depressed mood. However, it is possible to use inverse conditions.
Users can also go long on higher moons (new moons or full moons occurring at a price that is higher than the previous one when a new/full moon occurred) and short on lower moons, this would return a trend following strategy, using the inverse conditions (buy lower moons/sell higher moons) would return a contrarian strategy.
The above chart displays the strategy using default conditions.
The above chart displays the strategy of going long on a higher moon and selling on a lower moon.
Quick Summary
We provide a quick summary of the strategy using default conditions (buy on a new moon, sell on a full moon) on various tickers using the 4h timeframe (note that using a lower timeframe would return a backtest executing a lower number of trades).
Constant position sizing is used and no frictional costs are considered.
BTCUSD
The moon phases strategy has been regularly tested with BTCUSD, with traders highlighting how moon phases tend to occur during tops/bottoms. We test the strategy from 2019-01-06 00:00.
Net Profit: $68544.86 Closed Trades : 67 % Profitability : 50.75 Max Drawdown : $18541.24 Max
TSLA
The strategy is tested from 2011-01-04 14:30
Net profit: $349.17 Closed Trades : 265 % Profitability : 54.34 Max Drawdown : $262.72
EURUSD
The strategy is tested from 2018-01-16 14:00.
Net profit: $-0.18 Closed Trades : 91 % Profitability : 50.55 Max Drawdown : 0.36

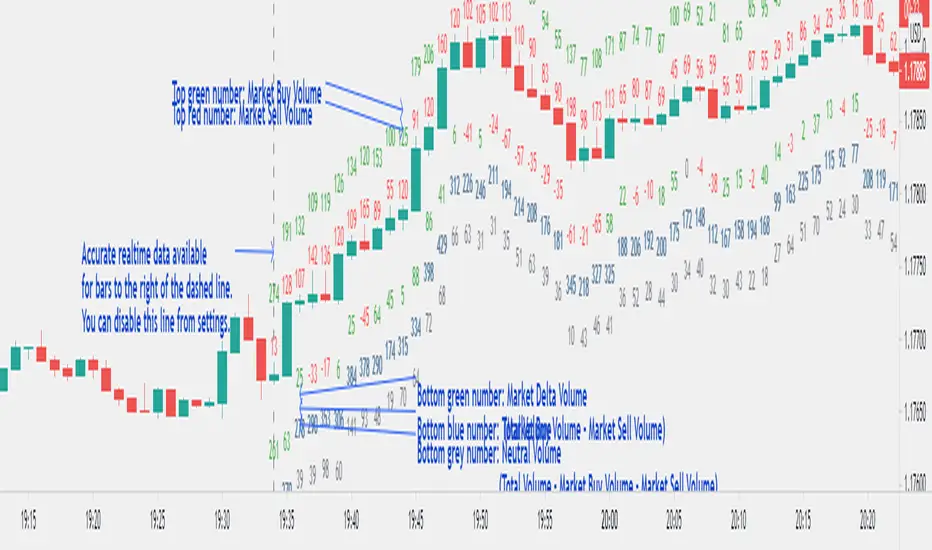
Market Delta Volume for Realtime BarsWhat is it?
Market Delta Volume Tool for real-time bars
A market delta tool that shows, (1) the volume that got transacted on upticks - or the market buy volume; (2) the volume that got transacted on downticks - or the market sell volume (3) the market delta volume (i.e., market buy volume - market sell volume); (4) the total volume (market buy volume + market sell volume + neutral volume); and (4) the volume that got transacted without a change in price - or the neutral volume (total volume = market buy volume + market sell volume + neutral volume)
NOTE: THIS WORKS ONLY ON REAL-TIME BARS, NOT ON HISTORICAL BARS! The dotted line marks the start of real-time data (i.e., the bar from which the indicator started collecting and displaying data). You will see accurate data only for bars to the right of this line.
The longer you keep a chart open with the study enabled, the more data it collects and displays and the better your analysis can potentially be.
Note that the data gets reset every time any of the options is changed, the market is switched, the browser is refreshed, or the script is reloaded.
DATA ISN'T STORED. I.e., every time a new symbol is loaded/or the same symbol is reloaded, data gets refreshed.
Who is it for?
For traders who are used to analyzing buy/sell activity using market delta information. Especially, short-term trader/scalpers who are used to keeping the same chart open through the trading session.
Also for traders to see and study how anomalies in volume can give clues to buyer/seller absorption, initiative buying/selling etc.
Can be used to better understand VSA as well, although not necessary.
Essentially, this gives real-time delta volume information; use it however you see fit.
CryptoSignalScanner - MACD Multiple Time FramesDESCRIPTION:
After receiving some multiple request to provide a MACD indicator that displays multiple timeframes at the same time I created this simple script.
You can use this script for free and adjust it as much you like.
With this script you can plot 6 MACD lines & 6 Signal lines.
• Current Timeframe MACD Line
• Current Timeframe Signal Line
• 15 minute candle MACD Line
• 15 minute candle Signal Line
• 30 minute candle MACD Line
• 30 minute candle Signal Line
• 1 hour candle MACD Line
• 1 hour candle Signal Line
• 2 hour candle MACD Line
• 2 hour candle Signal Line
• 4 hour candle MACD Line
• 4 hour candle Signal Line
HOW TO USE:
• When multiple MACD lines on an uptrend are grouped together it is time to SELL.
• When multiple MACD lines on a downtrend are grouped together it is time to BUY.
• The higher to length of the MACD lines the stronger the BUY/SELL signal.
FEATURES:
• You can show/hide the preferred MACD lines.
• You can show/hide the preferred Signal lines.
How MACD works
The MACD indicator is generated by subtracting two exponential moving averages (EMAs) to create the main line (MACD line), which is then used to calculate another EMA that represents the signal line. In addition, there is the MACD histogram, which is calculated based on the differences between those two lines. The histogram, along with the other two lines, fluctuates above and below a center line, which is also known as the zero line.
The MACD indicator consists of three elements moving around the zero line:
• The MACD line. By default the MACD line is calculated by subtracting the 26-day EMA from the 12-day EMA.
MACD line = 12d EMA - 26d EMA
• The signal line. By default the signal line is calculated from a 9-day EMA of the MACD line.
Signal line = 9d EMA of MACD line
• Histogram. The histogram is nothing more than a visual record of the relative movements of the MACD line and the signal line.
It is simply calculated as: MACD line - signal line
REMARKS:
• This advice is NOT financial advice.
• We do not provide personal investment advice and we are not a qualified licensed investment advisor.
• All information found here, including any ideas, opinions, views, predictions, forecasts, commentaries, suggestions, or stock picks, expressed or implied herein, are for informational, entertainment or educational purposes only and should not be construed as personal investment advice.
• We will not and cannot be held liable for any actions you take as a result of anything you read here.
• We only provide this information to help you make a better decision.
• While the information provided is believed to be accurate, it may include errors or inaccuracies.
Good Luck,
SEOCO

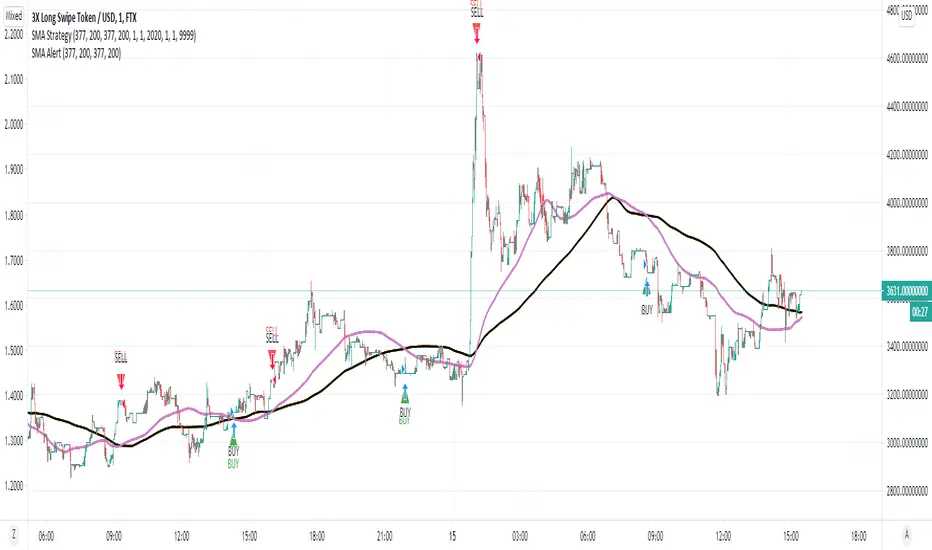
SMA Strategy - Indicator Version for AlertIn this indicator, I made use of two different sma intersections for buying and selling points. You can use the intersection of 2 sma values for buying and 2 separate sma intersection for selling.
There are 3 different alarms for those who want to set an alarm.
- Cross Alarm: The alarm that will work on buy-sell signals for those who have the right to set a single alarm.
- Buy Alarm: The alarm that will operate at the receiving point according to the values you specified.
- Sell Alarm: The alarm that will operate at the sales point according to the values you specify.
GnG - Cuan Sniper with 7MA and Buy Sell SignalThis Indicator possible users to get a signal when buying and selling.
Using Cross EMA :
when short EMA cross-up Long EMA is Signal to Buy
when short EMA cross-down Long EMA is Signal to Sell
Using Stochastic 14-3-3 to get signal overbought and oversold.
when oversold, and StochK is crossing-up stochD, will show signal to buy.
when overbought, and StockK is crossing-down stockD, will show signal to sell.
Using Parabolic SAR, Pivot H/L, Cloud and Linear Regression to find Resistance and Support.
Disclaimer On. Take your own risk.

FibMAThis study visually demonstrates Fibonacci moving averages.
The darker the color, the stronger the signal is for either buying or selling.
Buys/Sells only take place when each moving average is above/below the its adjactent fibonacci sequence, i.e 5<8<13<21<34<55<89<144 for buying..
Alerts are provided as BUY ASSET and SELL ASSET.
Multiple moving averages are also provided.

Sell / Buy RatesThis script finds sell / buy rates and adds its linear regression to the chart. its aim is finding buying and selling power, then you can try to find trend reversals. Also you can find divergences, it's very important signal for trend reversal.
Linear regression is a basic and commonly used type of predictive analysis.
if you choose lower periods then it will be more sensitive. I choose 34 as it's one of fibonnaci number.
If you find my works useful, please consider a donation
BTC: 16XRqyS3Vgh1knAU1tCcruqhUrVm4QWWmR

CryptogramTR with OPEN CODEIndicator is obtained by importing RSI(14) into HULL moving average source with 2 different periods, as one is long period and the other is short.
When green line (short period) cross upward the red line (long period) , this is a BUY; vice versa it is a SELL.
When HMA Short Period is set to 1 (one), yielding line is absolutely the same line of RSI (14). You can change it into 8(eight) preferably.
İndikatör, RSI(14) indikatörünün, hull hareketli ortalamasının kod kaynağı olarak atanması ile elde edilmiştir. Uzun ve kısa olmak üzere 2 ayrı periyot kullanılmıştır.
Yeşil çizgi yani kısa periyotlu çizgi, kırmızı yani uzun periyotlu olanı yukarı keserse AL, tersi durum SAT olarak düşünülmelidir.
Hull Kısa Periyodu 1 iken oluşan yeşil çizgi, RSI(14) indikatörünü vermektedir. Kısa periyot olarak tercihinize göre bu değeri 8 olarak da kullanabilirsiniz.

XPloRR MA-Trailing-Stop StrategyXPloRR MA-Trailing-Stop Strategy
Long term MA-Trailing-Stop strategy with Adjustable Signal Strength to beat Buy&Hold strategy
None of the strategies that I tested can beat the long term Buy&Hold strategy. That's the reason why I wrote this strategy.
Purpose: beat Buy&Hold strategy with around 10 trades. 100% capitalize sold trade into new trade.
My buy strategy is triggered by the fast buy EMA (blue) crossing over the slow buy SMA curve (orange) and the fast buy EMA has a certain up strength.
My sell strategy is triggered by either one of these conditions:
the EMA(6) of the close value is crossing under the trailing stop value (green) or
the fast sell EMA (navy) is crossing under the slow sell SMA curve (red) and the fast sell EMA has a certain down strength.
The trailing stop value (green) is set to a multiple of the ATR(15) value.
ATR(15) is the SMA(15) value of the difference between the high and low values.
The scripts shows a lot of graphical information:
The close value is shown in light-green. When the close value is lower then the buy value, the close value is shown in light-red. This way it is possible to evaluate the virtual losses during the trade.
the trailing stop value is shown in dark-green. When the sell value is lower then the buy value, the last color of the trade will be red (best viewed when zoomed)(in the example, there are 2 trades that end in gain and 2 in loss (red line at end))
the EMA and SMA values for both buy and sell signals are shown as a line
the buy and sell(close) signals are labeled in blue
How to use this strategy?
Every stock has it's own "DNA", so first thing to do is tune the right parameters to get the best strategy values voor EMA , SMA, Strength for both buy and sell and the Trailing Stop (#ATR).
Look in the strategy tester overview to optimize the values Percent Profitable and Net Profit (using the strategy settings icon, you can increase/decrease the parameters)
Then keep using these parameters for future buy/sell signals only for that particular stock.
Do the same for other stocks.
Important : optimizing these parameters is no guarantee for future winning trades!
Here are the parameters:
Fast EMA Buy: buy trigger when Fast EMA Buy crosses over the Slow SMA Buy value (use values between 10-20)
Slow SMA Buy: buy trigger when Fast EMA Buy crosses over the Slow SMA Buy value (use values between 30-100)
Minimum Buy Strength: minimum upward trend value of the Fast SMA Buy value (directional coefficient)(use values between 0-120)
Fast EMA Sell: sell trigger when Fast EMA Sell crosses under the Slow SMA Sell value (use values between 10-20)
Slow SMA Sell: sell trigger when Fast EMA Sell crosses under the Slow SMA Sell value (use values between 30-100)
Minimum Sell Strength: minimum downward trend value of the Fast SMA Sell value (directional coefficient)(use values between 0-120)
Trailing Stop (#ATR): the trailing stop value as a multiple of the ATR(15) value (use values between 2-20)
Example parameters for different stocks (Start capital: 1000, Order=100% of equity, Period 1/1/2005 to now) compared to the Buy&Hold Strategy(=do nothing):
BEKB(Bekaert): EMA-Buy=12, SMA-Buy=44, Strength-Buy=65, EMA-Sell=12, SMA-Sell=55, Strength-Sell=120, Stop#ATR=20
NetProfit: 996%, #Trades: 6, %Profitable: 83%, Buy&HoldProfit: 78%
BAR(Barco): EMA-Buy=16, SMA-Buy=80, Strength-Buy=44, EMA-Sell=12, SMA-Sell=45, Strength-Sell=82, Stop#ATR=9
NetProfit: 385%, #Trades: 7, %Profitable: 71%, Buy&HoldProfit: 55%
AAPL(Apple): EMA-Buy=12, SMA-Buy=45, Strength-Buy=40, EMA-Sell=19, SMA-Sell=45, Strength-Sell=106, Stop#ATR=8
NetProfit: 6900%, #Trades: 7, %Profitable: 71%, Buy&HoldProfit: 2938%
TNET(Telenet): EMA-Buy=12, SMA-Buy=45, Strength-Buy=27, EMA-Sell=19, SMA-Sell=45, Strength-Sell=70, Stop#ATR=14
NetProfit: 129%, #Trade

Candle Anatomy (feat. Dr. Rupward)# Candle Anatomy (feat. Dr. Rupward)
## Overview
This indicator dissects a single Higher Timeframe (HTF) candle and displays it separately on the right side of your chart with detailed anatomical analysis. Instead of cluttering your entire chart with analysis on every candle, this tool focuses on what matters most: understanding the structure and strength of the most recent HTF candle.
---
## Why I Built This
When analyzing price action, I often found myself manually calculating wick-to-body ratios, estimating retracement levels, and trying to gauge candle strength. This indicator automates that process and presents it in a clean, visual format.
The "Dr. Rupward" theme is just for fun – a lighthearted way to present technical analysis. Think of it as your chart's "health checkup." Don't take it too seriously, but do take the data seriously!
---
## How It Works
### 1. Candle Decomposition
The indicator breaks down the HTF candle into three components:
- **Upper Wick %** = (High - max(Open, Close)) / Range × 100
- **Body %** = |Close - Open| / Range × 100
- **Lower Wick %** = (min(Open, Close) - Low) / Range × 100
Where Range = High - Low
### 2. Strength Assessment
Based on body percentage:
- **Strong** (≥70%): High conviction move, trend likely to continue
- **Moderate** (40-69%): Normal price action
- **Weak** (<40%): Indecision, potential reversal or consolidation
### 3. Pressure Analysis
- **Upper Wick** indicates selling pressure (bulls pushed up, but sellers rejected)
- **Lower Wick** indicates buying pressure (bears pushed down, but buyers rejected)
Thresholds:
- ≥30%: Strong pressure
- 15-29%: Moderate pressure
- <15%: Weak pressure
### 4. Pattern Recognition
The indicator automatically detects:
| Pattern | Condition |
|---------|-----------|
| Doji | Body < 10% |
| Hammer | Lower wick ≥ 60%, Upper wick < 10%, Body < 35% |
| Shooting Star | Upper wick ≥ 60%, Lower wick < 10%, Body < 35% |
| Marubozu | Body ≥ 90% |
| Spinning Top | Body < 30%, Both wicks > 25% |
### 5. Fibonacci Levels
Displays key Fibonacci retracement and extension levels based on the candle's range:
**Retracement:** 0, 0.236, 0.382, 0.5, 0.618, 0.786, 1.0
**Extension:** 1.272, 1.618, 2.0, 2.618
**Negative Extension:** -0.272, -0.618, -1.0
These levels help identify potential support/resistance if price retraces into or extends beyond the analyzed candle.
### 6. Comparison with Previous Candle
When enabled, displays the previous HTF candle (semi-transparent) alongside the current one. This allows you to:
- Compare range expansion/contraction
- Observe momentum shifts
- Identify continuation or reversal setups
---
## Settings Explained
### Display Settings
- **Analysis Timeframe**: The HTF candle to analyze (default: Daily)
- **Offset from Chart**: Distance from the last bar (default: 15)
- **Candle Width**: Visual width of the anatomy candle
- **Show Previous Candle**: Toggle comparison view
### Fibonacci Levels
- Toggle individual levels on/off based on your preference
- Retracement levels for pullback analysis
- Extension levels for target projection
### Diagnosis Panel
- Shows pattern name, strength assessment, and expected behavior
- Can be toggled off if you prefer minimal display
---
## Use Cases
1. **Swing Trading**: Analyze daily candle structure before entering on lower timeframes
2. **Trend Confirmation**: Strong body % with minimal upper wick = healthy trend
3. **Reversal Detection**: Hammer/Shooting Star patterns with high wick %
4. **Target Setting**: Use Fibonacci extensions for take-profit levels
---
## Notes
- This indicator is designed for analysis, not for generating buy/sell signals
- Works best on liquid markets with clean price action
- The "diagnosis" is algorithmic interpretation, not financial advice
- Combine with your own analysis and risk management
---
## About the Name
"Dr. Rupward" is a playful persona I created – combining "Right" + "Upward" (my trading philosophy) with a doctor theme because we're "diagnosing" candle health. It's meant to make technical analysis a bit more fun and approachable. Enjoy!
---
## Feedback Welcome
If you find this useful or have suggestions for improvement, feel free to leave a comment. Happy trading!

RSI Fibonacci Flow [JOAT]RSI Fibonacci Flow - Advanced Fibonacci Retracement with RSI Confluence
Introduction
RSI Fibonacci Flow is an open-source overlay indicator that combines automatic Fibonacci retracement levels with RSI momentum analysis to identify high-probability trading zones. The indicator automatically detects swing highs and lows, draws Fibonacci levels, and generates confluence signals when RSI conditions align with key Fibonacci zones.
This indicator is designed for traders who use Fibonacci retracements but want additional confirmation from momentum analysis before entering trades.
Originality and Purpose
This indicator is NOT a simple mashup of RSI and Fibonacci tools. It is an original implementation that creates a synergistic relationship between two complementary analysis methods:
Why Combine RSI with Fibonacci? Fibonacci retracements identify WHERE price might reverse, but they don't tell you WHEN. RSI provides the timing component by showing momentum exhaustion. When price reaches the Golden Zone (50%-61.8%) AND RSI shows oversold conditions, the probability of a successful bounce increases significantly.
Original Confluence Scoring System: The indicator calculates a 0-5 confluence score that weights multiple factors: Golden Zone presence (+2), entry zone presence (+1), RSI extreme alignment (+1), RSI divergence (+1), and strong RSI momentum (+1). This scoring system is original to this indicator.
Automatic Pivot Detection: Unlike manual Fibonacci tools, this indicator automatically detects swing highs and lows using a configurable pivot algorithm, then draws Fibonacci levels accordingly. The pivot detection uses a center-bar comparison method that checks if a bar's high/low is the highest/lowest within the specified depth on both sides.
Dynamic Trend Awareness: The indicator determines trend direction based on pivot sequence (last pivot was high or low) and adjusts Fibonacci orientation accordingly. In uptrends, 0% is at swing low; in downtrends, 0% is at swing high.
Each component serves a specific purpose:
Fibonacci levels identify potential reversal zones based on natural price ratios
RSI provides momentum context to filter out low-probability setups
Confluence scoring quantifies setup quality for position sizing decisions
Automatic pivot detection removes subjectivity from level placement
Core Concept: RSI-Fibonacci Confluence
The most powerful trading setups occur when multiple factors align. RSI Fibonacci Flow identifies these moments by:
Automatically detecting price pivots and drawing Fibonacci levels
Tracking which Fibonacci zone the current price occupies
Monitoring RSI for overbought/oversold conditions
Generating signals when RSI extremes coincide with key Fibonacci levels
Scoring confluence strength on a 0-5 scale
When price reaches the Golden Zone (50%-61.8%) while RSI shows oversold conditions in an uptrend, the probability of a bounce increases significantly.
Fibonacci Levels Explained
The indicator draws nine Fibonacci levels based on the most recent swing:
0% (Swing Low/High): The starting point of the move
23.6%: Shallow retracement - often seen in strong trends
38.2%: First significant support/resistance level
50%: Psychological midpoint of the move
61.8% (Golden Ratio): The most important Fibonacci level
78.6%: Deep retracement - last defense before trend failure
100% (Swing High/Low): The end point of the move
127.2% (TP1): First extension target for take profit
161.8% (TP2): Second extension target for take profit
The Golden Zone
The area between 50% and 61.8% is highlighted as the "Golden Zone" because:
It represents the optimal retracement depth for trend continuation
Institutional traders often place orders in this zone
It offers favorable risk-to-reward ratios
Price frequently bounces from this area in healthy trends
When price enters the Golden Zone, the indicator highlights it with a semi-transparent box and optional background coloring.
Pivot Detection System
The indicator uses a configurable pivot detection algorithm:
pivotDetect(float src, int len, bool isHigh) =>
int halfLen = len / 2
float centerVal = nz(src , src)
bool isPivot = true
for i = 0 to len - 1
if isHigh
if nz(src , src) > centerVal
isPivot := false
break
else
if nz(src , src) < centerVal
isPivot := false
break
isPivot ? centerVal : float(na)
This identifies swing highs and lows by checking if a bar's high/low is the highest/lowest within the specified depth on both sides.
Visual Components
1. Fibonacci Lines
Horizontal lines at each Fibonacci level:
Solid lines for major levels (0%, 50%, 61.8%, 100%)
Dashed lines for secondary levels (23.6%, 38.2%, 78.6%)
Dotted lines for extension levels (127.2%, 161.8%)
Color-coded for easy identification
Configurable line width
2. Fibonacci Labels
Price labels at each level showing:
Fibonacci percentage
Actual price at that level
Golden Zone label highlighted
TP1 and TP2 labels for targets
3. Golden Zone Box
A semi-transparent box highlighting the 50%-61.8% zone:
Gold colored border and fill
Extends from swing start to current bar (or beyond if extended)
Provides clear visual of the optimal entry zone
4. ZigZag Lines
Connecting lines between detected pivots:
Cyan for moves from low to high
Orange for moves from high to low
Helps visualize market structure
Configurable line width
5. Pivot Markers
Small labels at detected swing points:
"HH" (Higher High) at swing highs
"LL" (Lower Low) at swing lows
Helps track market structure
6. Entry Signals
BUY and SELL labels when confluence conditions are met:
BUY: RSI oversold + price in entry zone + uptrend + positive momentum
SELL: RSI overbought + price in entry zone + downtrend + negative momentum
Labels include "RSI+FIB" to indicate confluence
Confluence Scoring System
The indicator calculates a confluence score from 0 to 5:
+2 points: Price is in the Golden Zone (50%-61.8%)
+1 point: Price is in the entry zone (38.2%-61.8%)
+1 point: RSI is oversold in uptrend OR overbought in downtrend
+1 point: RSI divergence detected (bullish or bearish)
+1 point: Strong RSI momentum (change > 2 points)
Confluence ratings:
STRONG (4-5): Multiple factors align - high probability setup
MODERATE (2-3): Some factors align - proceed with caution
WEAK (0-1): Few factors align - wait for better setup
Dashboard Panel
The 10-row dashboard provides comprehensive analysis:
RSI Value: Current RSI reading (large text)
RSI State: OVERBOUGHT, OVERSOLD, BULLISH, BEARISH, or NEUTRAL
Fib Trend: UPTREND or DOWNTREND based on last pivot sequence
Price Zone: Current Fibonacci zone (e.g., "GOLDEN ZONE", "38.2% - 50%")
Price: Current close price (large text)
Confluence: Score rating with numeric value (e.g., "STRONG (4/5)")
Nearest Fib: Closest key Fibonacci level with price
TP1 (127.2%): First take profit target price
TP2 (161.8%): Second take profit target price
Input Parameters
Pivot Detection:
Pivot Depth: Bars to look back for swing detection (default: 10)
Min Deviation %: Minimum price move to confirm pivot (default: 1.0)
RSI Settings:
RSI Length: Period for RSI calculation (default: 14)
Source: Price source (default: close)
Overbought: Upper threshold (default: 70)
Oversold: Lower threshold (default: 30)
Fibonacci Display:
Show Fib Lines: Toggle Fibonacci lines (default: enabled)
Show Fib Labels: Toggle price labels (default: enabled)
Show Golden Zone Box: Toggle zone highlight (default: enabled)
Line Width: Thickness of Fibonacci lines (default: 2)
Extend Fib Lines: Extend lines into future (default: enabled)
ZigZag:
Show ZigZag: Toggle connecting lines (default: enabled)
ZigZag Width: Line thickness (default: 2)
Signals:
Show Entry Signals: Toggle BUY/SELL labels (default: enabled)
Show TP Levels: Toggle take profit in dashboard (default: enabled)
Show RSI-Fib Confluence: Toggle confluence analysis (default: enabled)
Dashboard:
Show Dashboard: Toggle information panel (default: enabled)
Position: Choose corner placement
Colors:
Bullish: Color for bullish elements (default: cyan)
Bearish: Color for bearish elements (default: orange)
Neutral: Color for neutral elements (default: gray)
Golden Zone: Color for Golden Zone highlight (default: gold)
How to Use RSI Fibonacci Flow
Identifying Entry Zones:
Wait for price to retrace to the 38.2%-61.8% zone
Check if RSI is approaching oversold (for longs) or overbought (for shorts)
Look for STRONG confluence rating in the dashboard
Enter when BUY or SELL signal appears
Setting Take Profit Targets:
TP1 at 127.2% extension for conservative target
TP2 at 161.8% extension for aggressive target
Consider scaling out at each level
Using the Price Zone:
"BELOW 23.6%" - Price hasn't retraced much; wait for deeper pullback
"23.6% - 38.2%" - Shallow retracement; strong trend continuation possible
"38.2% - 50%" - Good entry zone for trend trades
"GOLDEN ZONE" - Optimal entry zone; highest probability
"61.8% - 78.6%" - Deep retracement; trend may be weakening
"78.6% - 100%" - Very deep; trend reversal possible
"ABOVE/BELOW 100%" - Trend has likely reversed
Confluence Trading Strategy:
Only take trades with confluence score of 3 or higher
STRONG confluence (4-5) warrants larger position size
MODERATE confluence (2-3) warrants smaller position size
WEAK confluence (0-1) - wait for better setup
Alert Conditions
Ten alert conditions are available:
RSI-Fib BUY Signal: Strong bullish confluence detected
RSI-Fib SELL Signal: Strong bearish confluence detected
Price in Golden Zone: Price enters 50%-61.8% zone
New Pivot High: Swing high detected
New Pivot Low: Swing low detected
RSI Overbought: RSI crosses above overbought threshold
RSI Oversold: RSI crosses below oversold threshold
Bullish Divergence: Potential bullish RSI divergence
Bearish Divergence: Potential bearish RSI divergence
Strong Confluence: Confluence score reaches 4 or higher
Understanding Trend Direction
The indicator determines trend based on pivot sequence:
UPTREND: Last pivot was a low after a high (expecting move up)
DOWNTREND: Last pivot was a high after a low (expecting move down)
Fibonacci levels are drawn accordingly:
In uptrend: 0% at swing low, 100% at swing high
In downtrend: 0% at swing high, 100% at swing low
Bar Coloring
When confluence features are enabled:
Cyan bars on strong bullish signals
Orange bars on strong bearish signals
Gold-tinted bars when price is in Golden Zone
Best Practices
Use on 1H timeframe or higher for more reliable pivots
Adjust Pivot Depth based on timeframe (higher for longer timeframes)
Wait for price to enter Golden Zone before considering entries
Confirm RSI is in favorable territory before trading
Use extension levels (127.2%, 161.8%) for realistic profit targets
Combine with support/resistance and candlestick patterns
Higher confluence scores indicate higher probability setups
Limitations
Pivot detection has inherent lag (must wait for confirmation)
Fibonacci levels are subjective - different swings produce different levels
Works best in trending markets with clear swings
RSI can remain overbought/oversold in strong trends
Not all Golden Zone entries will be successful
The source code is open and available for review and modification.
Disclaimer
This indicator is provided for educational and informational purposes only. It is not financial advice. Trading involves substantial risk of loss. Past performance does not guarantee future results. Fibonacci levels are not guaranteed support/resistance - they are probability zones based on historical price behavior. Always conduct your own analysis and use proper risk management.
- Made with passion by officialjackofalltrades :D

Delta Reaction Zones [BOSWaves]Delta Reaction Zones - Cumulative Delta-Based Supply and Demand Identification with Flow-Weighted Zone Construction
Overview
Delta Reaction Zones is a volume flow-aware supply and demand detection system that identifies price levels where significant buying or selling pressure accumulated, constructing adaptive zones around cumulative delta extremes with intelligent flow composition analysis.
Instead of relying on traditional price-based support and resistance or fixed pivot structures, zone placement, thickness, and directional characterization are determined through delta accumulation patterns, volatility-adaptive sizing, and the proportional composition of positive versus negative volume flow.
This creates dynamic reaction boundaries that reflect actual order flow imbalances rather than arbitrary price levels - contracting during low volatility environments, expanding during elevated volatility periods, and incorporating flow composition statistics to reveal whether zones formed under buying or selling dominance.
Price is therefore evaluated relative to zones anchored at delta extremes rather than conventional technical levels.
Conceptual Framework
Delta Reaction Zones is founded on the principle that meaningful support and resistance emerge where cumulative volume flow reaches local extremes rather than where price alone forms patterns.
Traditional support and resistance methods identify turning points through price structure, which often ignores the underlying order flow dynamics that drive those reversals. This framework replaces price-centric logic with delta-driven zone construction informed by actual buying and selling pressure.
Three core principles guide the design:
Zone placement should correspond to cumulative delta extremes, not price pivots alone.
Zone thickness must adapt to current market volatility conditions.
Flow composition context reveals whether zones formed under accumulation or distribution.
This shifts supply and demand analysis from static price levels into adaptive, flow-anchored reaction boundaries.
Theoretical Foundation
The indicator combines delta proxy methodology, cumulative volume tracking, adaptive volatility measurement, and flow decomposition analysis.
A signed volume delta proxy estimates directional order flow on each bar, which accumulates into a running cumulative delta series. Pivot detection identifies local extremes in either cumulative delta or its rate of change, marking levels where flow momentum reached inflection points. Average True Range (ATR) provides volatility-responsive zone sizing, while impulse window analysis decomposes recent flow into positive and negative components with percentage weighting.
Four internal systems operate in tandem:
Delta Accumulation Engine : Computes smoothed signed volume and maintains cumulative delta tracking for directional flow measurement.
Pivot Detection System : Identifies significant turning points in cumulative delta or delta rate of change to anchor zone placement.
Adaptive Zone Construction : Scales zone thickness dynamically using ATR-based volatility measurement around pivot anchors.
Flow Composition Analysis : Calculates positive and negative flow percentages over a configurable impulse window to characterize zone formation context.
This design allows zones to reflect actual order flow behavior rather than reacting mechanically to price formations.
How It Works
Delta Reaction Zones evaluates price through a sequence of flow-aware processes:
Signed Volume Delta Calculation : Each bar's volume is directionally signed based on close-open relationship, creating a proxy for buying versus selling pressure.
Cumulative Delta Tracking : Signed volume accumulates into a running total, revealing sustained directional flow over time.
Pivot Identification : Local highs and lows in cumulative delta (or its rate of change) mark significant flow inflection points where zones anchor.
Volatility-Adaptive Sizing : ATR multiplier determines zone half-width, automatically adjusting thickness to current market conditions.
Flow Decomposition : Positive and negative volume components are separated and percentage-weighted over the impulse window to reveal dominant flow direction.
Intelligent Zone Merging : Overlapping zones of the same type automatically merge into broader reaction areas, with flow statistics blended proportionally.
Dynamic Extension and Visualization : Zones extend forward with gradient-filled composition segments showing buy versus sell flow proportions.
Breach Detection and Cleanup : Zones invalidate automatically when price closes beyond their boundaries, maintaining chart clarity.
Together, these elements form a continuously updating supply and demand framework anchored in order flow reality.
Interpretation
Delta Reaction Zones should be interpreted as flow-anchored supply and demand boundaries:
Support Zones (Green) : Form at cumulative delta lows, marking levels where selling exhaustion or buying accumulation occurred.
Resistance Zones (Red) : Establish at cumulative delta highs, identifying areas where buying exhaustion or selling distribution dominated.
Flow Composition Segments : Visual gradient within each zone reveals the buy/sell flow proportion during zone formation. The upper segment (red tint) represents negative (selling) flow percentage while the lower segment (green tint) represents positive (buying) flow percentage.
BUY FLOW / SELL FLOW / MIXED Labels : Indicate dominant flow character when one direction exceeds 60% of total impulse window activity.
Net Delta Statistics : Display cumulative flow totals (Δ) alongside percentage breakdowns for immediate context.
Zone Thickness : Reflects current volatility environment - wider zones in volatile conditions, tighter zones in calm markets.
Zone Merging : Multiple nearby pivots consolidate into broader reaction areas, weighted by their respective flow magnitudes.
Flow composition, volatility context, and delta magnitude outweigh isolated price reactions.
Signal Logic & Visual Cues
Delta Reaction Zones presents two primary interaction signals:
Support Reclaim (RC) : Green label appears when price crosses back above a support zone's midline after trading below it, suggesting renewed buying interest.
Resistance Re-enter (RE) : Red label displays when price crosses back below a resistance zone's midline after trading above it, indicating resumed selling pressure.
Alert generation covers zone creation and midline reclaim/re-entry events for systematic monitoring.
Strategy Integration
Delta Reaction Zones fits within order flow-informed and supply/demand trading approaches:
Flow-Anchored Entry Zones : Use zones as high-probability reaction areas where historical order flow imbalances occurred.
Composition-Based Bias : Favor trades aligning with dominant flow character - long setups near zones formed under buying dominance, short setups near selling-dominated zones.
Volatility-Aware Targeting : Expect wider reaction ranges when ATR expands zones, tighter ranges when ATR contracts them.
Merge-Informed Conviction : Broader merged zones represent multiple flow inflection points, potentially offering stronger support/resistance.
Midline Reclaim Validation : Use RC/RE signals as confirmation of zone respect rather than standalone entry triggers.
Multi-Timeframe Flow Context : Apply higher-timeframe delta zones to inform lower-timeframe entry precision.
Technical Implementation Details
Core Engine : Signed volume delta proxy with EMA smoothing
Accumulation Model : Persistent cumulative delta tracking with optional rate-of-change pivot detection
Zone Construction : ATR-scaled thickness around pivot anchors
Flow Analysis : Positive/negative decomposition over configurable impulse window
Visualization : Gradient-filled zones with embedded flow statistics and percentage segments
Signal Logic : Midline crossover detection with breach-based invalidation
Merge System : Proximity-based consolidation with weighted flow blending
Performance Profile : Optimized for real-time execution with configurable zone limits
Optimal Application Parameters
Timeframe Guidance:
1 - 5 min : Micro-structure flow zones for scalping and short-term reversals
15 - 60 min : Intraday supply/demand identification with flow context
4H - Daily : Swing-level reaction zones with macro flow characterization
Suggested Baseline Configuration:
Delta Smoothing Length : 3
Pivot Length : 12
Pivot Source : Cumulative Delta
Impulse Window : 100
ATR Length : 14
ATR Multiplier : 0.35 (reduce for lower timeframes)
Maximum Zones : 8
Merge Overlapping Zones : Enabled
Merge Gap : 20 ticks
These suggested parameters should be used as a baseline; their effectiveness depends on the asset's volume profile, tick structure, and preferred zone density, so fine-tuning is expected for optimal performance.
Parameter Calibration Notes
Use the following adjustments to refine behavior without altering the core logic:
Zones appearing oversized : Reduce ATR Multiplier to tighten zone thickness, especially on lower timeframes.
Excessive zone clutter : Increase Pivot Length to demand stronger delta extremes before zone creation.
Unstable delta readings : Increase Delta Smoothing Length to reduce bar-to-bar noise in flow calculation.
Missing significant levels : Decrease Pivot Length or switch Pivot Source to "Cumulative Delta RoC" for flow acceleration sensitivity.
Flow percentages feel stale : Reduce Impulse Window Length to emphasize more recent buying/selling composition.
Too many merged zones : Decrease Merge Gap (ticks) or disable merging to preserve individual pivot zones.
Adjustments should be incremental and evaluated across multiple session types rather than isolated market conditions.
Performance Characteristics
High Effectiveness:
Markets with consistent volume and order flow characteristics
Instruments where delta proxy correlates well with actual tape reading
Mean-reversion strategies targeting flow exhaustion zones
Trend continuation entries at zones aligned with dominant flow direction
Reduced Effectiveness:
Extremely low volume environments where delta proxy becomes unreliable
News-driven or gapped markets with discontinuous flow
Highly manipulated or illiquid instruments with erratic volume patterns
Integration Guidelines
Confluence : Combine with BOSWaves structure, market profile, or traditional supply/demand analysis
Flow Respect : Trust zones formed with strong net delta magnitude and clear flow dominance
Context Awareness : Consider whether current market regime matches zone formation conditions
Merge Recognition : Treat merged zones as higher-conviction areas due to multiple flow inflections
Breach Discipline : Exit zone-based setups cleanly when price invalidates boundaries
Disclaimer
Delta Reaction Zones is a professional-grade order flow and supply/demand analysis tool. It uses a volume-based delta proxy that estimates directional pressure but does not access true order book data. Results depend on market conditions, volume reliability, parameter selection, and disciplined execution. BOSWaves recommends deploying this indicator within a broader analytical framework that incorporates price structure, volatility context, and comprehensive risk management.

CVD Flow Dashboard [AMT Edition] + Unified AlertsCVD Flow Dashboard – Live Bar Alerts
1️⃣ Purpose of the Tool
The CVD Flow Dashboard is a reaction-based tool. It does not predict the market; it reacts to real-time order flow imbalances:
Detects strong buying/selling pressure (Delta)
Confirms trend alignment (CVD)
Detects absorption and continuation signals
It is designed to show micro (bar-level) and macro (trend) context simultaneously, allowing you to enter trades after a real market reaction occurs, rather than preempting it.
2️⃣ When to Use It
Use this dashboard in real-time trading for reaction trades:
After an attempted market move is absorbed
Market tests a level (high or low of prior bar) but fails — this is absorption.
Example: buyers push price down but sellers absorb → bullish absorption.
Minimum alignment required:
Delta: strong buy/sell delta
CVD: confirms trend direction
Acceptance: continuation candle breaks prior high/low in alignment with delta/CVD
Optional: Sequence (SEQ) — if the next bar continues the acceptance pattern, confidence rises.
Key point: only act after absorption and alignment, never before.
Recommended Integrations for Best Quality Use:
Auction Session Ranges (AMT Edition) – provides session extremes for context and levels.
CVD Flow Labels for Session Ranges – shows delta alignment across session levels.
All-in-One CVD: Failed Auction + Trap + Flow Classifications – adds absorption, trap, and flow classification confluence.
Using these together provides full micro + macro context, improving trade quality and confidence.
3️⃣ Step-by-Step Usage
Step 1: Monitor the Dashboard
Watch Delta, CVD, Acceptance, and Sequence.
Absorption often occurs without immediate alignment — this is the setup stage.
Step 2: Wait for Absorption
Bullish absorption: strong buy delta, failed auction low, price starting upward reaction
Bearish absorption: strong sell delta, failed auction high, price starting downward reaction
Step 3: Confirm the 3 Minimum Boxes
Delta → strong and aligned with absorption
CVD → trend confirmation
Acceptance → bar closes beyond prior high/low
Proceed only if all three align
Step 4: Check for Sequence (Optional)
Next bar continues pattern → higher-confidence setup
Not required, but reinforces trade quality
4️⃣ Entering Trades
Reaction trade: enter immediately once 3 minimum boxes align after absorption / absorption area re-test.
LONG = Bull absorption + CVD bullish + Acceptance
SHORT = Bear absorption + CVD bearish + Acceptance
Sequence bonus: can add to position or widen stop for confidence
5️⃣ Risk Management / Protecting Positions
Initial Stop-Loss: just beyond failed auction extreme (low for bullish, high for bearish)
Trailing Stop / Sequence Protection: trail below prior bar lows/highs if sequence occurs
Avoid Over-Exposure: multiple trades can occur, but only if alignment is verified
Time Sensitivity: reaction trades are intraday/high-frequency — avoid holding overnight without macro confirmation
6️⃣ Practical Tips
Do not trade solely on absorption — wait for minimum 3-box alignment
Use Sequence only as reinforcement
Watch volume spikes and strong delta — often precede absorption/continuation
Best used on 15-minute timeframe ✅ ✅ or higher for swing intraday confirmation; lower timeframes (5 min) for live reaction trades
Combine with Auction Session Ranges, CVD Flow Labels, and All-in-One CVD tools for best quality trade context
✅ Live Bar Alerts
Alerts trigger on the current live bar best, not just at close make sure it continues if you choose to use at close of candle, when:
Bull alignment: Delta + CVD + Acceptance align (Sequence optional)
Bear alignment: Delta + CVD + Acceptance align (Sequence optional)
Alerts continue after bar close if conditions persist, allowing both immediate reaction entries or confirmation at bar close.
✅ Summary Workflow (Reaction Trade Flow)
Market attempts a move → Absorption occurs
Check 3 minimum boxes: Delta + CVD + Acceptance
Optional: Sequence confirms continuation
Enter trade immediately
Place stop-loss just beyond absorption extreme
Use Sequence for trailing stop or scaling confidence
“Let the market react first, then follow the confirmed flow” — this is why it’s a reaction tool, not predictive.

VRVP Clone + Multi-POC -- PerroGordoVRVP Clone + Multi-POC
Overview
VRVP Clone + Multi-POC replicates TradingView's native Visible Range Volume Profile with several practical enhancements. The indicator displays volume distribution across price levels for the visible chart range, which is useful for identifying high-volume nodes, support/resistance zones, and areas of price acceptance.
The main differentiator from the built-in VRVP is support for multiple Point of Control (POC) lines with an intelligent peak detection algorithm. Instead of just showing the single highest-volume level, you can identify distinct volume clusters across different price zones.
Features
Dynamic Visible Range
Recalculates automatically on scroll or zoom
Analyzes only visible bars
Profile width scales proportionally to view
Multiple POC Detection (1-8 levels)
Volume Nodes Mode: Peak detection algorithm finds local volume maxima across distinct price clusters
Highest Rows Mode: Traditional approach - top N rows by raw volume
Configurable minimum separation between nodes to prevent bunching
Individual colors for each POC level
Volume Display Modes
Up/Down: Split bars showing buy vs. sell volume with black outlines for visual separation
Total: Single bar colored by dominant direction
Delta: Net volume (buy minus sell)
Delta Intensity: Gradient coloring indicating buyer/seller dominance strength per row
Value Area
Configurable percentage (default 70%)
VAH and VAL lines with customizable styles
Separate colors for volume inside vs. outside the Value Area
Positioning Options
Left or Right placement
Adjustable profile width as percentage of visible range
Row configuration via "Number of Rows" or "Ticks Per Row"
Additional Features
Statistics table showing bars analyzed, total volume, up/down percentages, price vs POC
POC price labels on chart
Line style options (Solid, Dashed, Dotted)
+++++
How It Works
Volume from each bar is distributed across price rows based on the bar's high-low range. The allocation is proportional - if a bar spans 3 rows with 60% overlap on one row, that row receives 60% of the bar's volume.
Volume Nodes Mode identifies local peaks in the distribution (rows where volume exceeds both neighbors), then selects the highest peaks while enforcing minimum separation. This surfaces distinct support/resistance clusters rather than stacking all POC lines in a single high-volume area.
+++++
Settings
Inputs
Setting - Description
Rows Layout - "Number of Rows" or "Ticks Per Row"
Row Size - Number of rows (24-200) or ticks per row
Volume - "Up/Down", "Total", "Delta", or source selection
Value Area % - Percentage of volume for Value Area (default 70%)
Profile Width % - Width as percentage of visible bars
Placement - "Right" or "Left" side of chart
Enhancements
Setting - Description
Number of POCs | 1-8 POC lines |
POC Mode - "Volume Nodes" (peak detection) or "Highest Rows" (traditional)
Min Node Separation - Minimum rows between nodes (0 = auto-calculate)
Delta Intensity Mode - Gradient coloring by dominance
Show Stats Table - Display analysis statistics
Style
Setting - Description
Up/Down Volume Colors - Buy/sell volume colors
Value Area Colors - Colors for VA regions
POC/VAH/VAL Colors - Line colors and styles
POC 2-8 Colors - Colors for additional POC levels
+++++
Applications
Support/Resistance Identification
High-volume nodes tend to act as price magnets. Multiple POCs reveal layered S/R zones that aren't visible with a single POC.
Fair Value Reference
The Value Area represents where 70% of volume traded. Price tends to revert to this zone.
Volume Gap Analysis
Low-volume areas between POCs indicate prices that were rejected quickly - potential breakout or breakdown levels.
Market Structure
Multiple POCs across price levels show where the market has found acceptance, useful for distinguishing range-bound conditions from trending moves.
+++++
Practical Notes
Volume Nodes mode with 3-5 POCs works well for identifying distinct S/R clusters
Higher row counts give more granular analysis on lower timeframes
Delta Intensity mode quickly shows buyer/seller dominance at each level without the visual noise of split bars
If POCs are too clustered, increase Min Node Separation; if too spread out, decrease it or set to 0 for auto
The stats table vs POC comparison is useful for quick directional bias assessment
+++++
Requirements
Any instrument with volume data
Works well on futures, forex, and liquid equities
Pine Script v6
+++++
Version History
v1.1
- Added Volume Nodes mode with peak detection
- Expanded to 8 POC levels
- Added Min Node Separation setting
- Fixed POC label positioning for left placement
- Added black outlines to Up/Down volume bars
v1.0
- Initial release replicating VRVP with multi-POC enhancement
- Delta Intensity mode
- Statistics table

Institutional Zone Detector [Scalping-Algo]█ OVERVIEW
The Institutional Zone Detector identifies key supply and demand zones where large market participants (institutions, banks, hedge funds) have likely placed significant orders. These zones often act as powerful support and resistance levels, making them strategic areas for trade entries and exits.
This indicator is non-repainting, meaning once a signal appears on your chart, it will never disappear or change position. What you see in backtesting is exactly what you would have seen in real-time.
█ CORE CONCEPT
Markets move when large players execute substantial orders. These orders leave footprints in the form of specific candlestick patterns:
Demand Zones (Bullish)
When institutions accumulate positions, we often see a bearish candle followed by a strong bullish sequence. The last bearish candle before this move marks the demand zone - an area where buying pressure overwhelmed sellers.
Supply Zones (Bearish)
When institutions distribute positions, we typically see a bullish candle followed by a strong bearish sequence. The last bullish candle before this move marks the supply zone - an area where selling pressure overwhelmed buyers.
Price has a tendency to revisit these zones, offering potential trade opportunities.
█ HOW IT WORKS
The indicator scans for:
1. A potential zone candle (bearish for demand, bullish for supply)
2. A sequence of consecutive candles in the opposite direction
3. Optional: A minimum percentage move to filter weak signals
When all conditions are met, the zone is marked on your chart with:
• Upper and lower boundaries (solid lines)
• Equilibrium/midpoint level (cross marker)
• Extended channel lines for easy visualization
█ SETTINGS
Consecutive Candles Required (Default: 5)
Number of same-direction candles needed after the zone candle to confirm the pattern. Higher values = fewer but stronger signals.
Minimum Move Threshold % (Default: 0.0)
Minimum percentage price movement required to validate a zone. Increase this to filter out weak moves and focus on significant institutional activity.
Display Full Candle Range (Default: Off)
• Off: Shows Open-to-Low for demand zones, Open-to-High for supply zones
• On: Shows complete High-to-Low range of the zone candle
Show Demand/Supply Zone Channel (Default: On)
Toggle extended horizontal lines that project the zone levels across your chart.
Visual Theme (Default: Dark)
Choose between Dark (white/blue) or Light (green/red) color schemes.
Show Statistics Panel (Default: Off)
Displays a floating panel with exact price levels of the most recent zones.
Display Info Tooltip (Default: Off)
Shows an information label with indicator documentation.
█ HOW TO USE
Entry Strategies
1. Zone Bounce (Mean Reversion)
• Wait for price to return to a previously identified zone
• Look for rejection candles (pin bars, engulfing patterns) at zone levels
• Enter in the direction of the original zone (long at demand, short at supply)
• Place stops beyond the zone boundary
2. Zone Break (Momentum)
• When price breaks through a zone with strong momentum
• The broken zone often becomes the opposite type (broken demand becomes supply)
• Use for trend continuation trades
3. Equilibrium Trades
• The midpoint (cross marker) often acts as a magnet for price
• Can be used as a first target or as an entry point for scaled positions
Risk Management
• Always place stop-loss orders beyond zone boundaries
• Consider the zone width when calculating position size
• Wider zones = wider stops = smaller position size
• Use the equilibrium level for partial profit taking
Best Practices
• Higher timeframes produce more reliable zones
• Zones on multiple timeframes (confluence) are stronger
• Fresh/untested zones are more powerful than zones that have been touched multiple times
• Combine with other analysis methods (trend direction, volume, market structure)
█ ALERTS
Two alert conditions are available:
• "Demand Zone Identified" - Triggers when a new demand zone is detected
• "Supply Zone Identified" - Triggers when a new supply zone is detected
To set up alerts: Click on the indicator name → Add Alert → Select condition
█ IMPORTANT NOTES
• This indicator is a tool for analysis, not a complete trading system
• Signals are NOT automatic buy/sell recommendations
• Always use proper risk management
• Past performance does not guarantee future results
• Works on all markets and timeframes
• Non-repainting: Signals appear only after bar close confirmation
█ ACKNOWLEDGMENTS
Inspired by institutional order flow concepts and smart money trading methodologies. Built with a focus on reliability and practical application.
